Agility Accelerator Help Guide
Results: Network Diagram
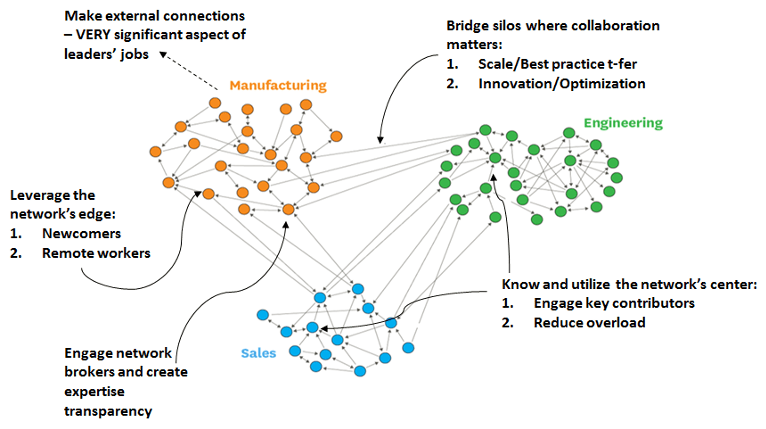
Agility is dependent upon the ability to manage five key points in any given network. This tool allows you to visualize these dimensions to ensure the group is operating for peak performance.
- Managing the Center: Minimizing collaborative bottlenecks and acknowledging/ developing employees that make their colleagues successful through collaboration.
- Leveraging the Periphery: Rapidly integrating newcomers, creating inclusive contents for remote employees and reengaging under-connected high-performers.
- Selectively Bridging Silos: Facilitating effective collaboration at key intersections in the network (such as functions, locations, roles, etc.)
- Developing Awareness or Network Roles and Expertise: Ensuring that expertise and roles are transparent.
- Manage External Connections: Obtaining resources (time, talent, funding, etc.), sourcing, shaping, aligning incoming work, influencing decision-makers, innovating across boundaries.
The network diagram provides insight into the state of key network drivers, important to high-performing groups. The concepts are highlighted here:
Examine Your Network
The “Filters” tab allows you to explore your groups networks, manipulating them through the selection of any combination of attributes, as well as the networks of individuals. The “Network Summary” view identifies the people who are most connected, least connected, and who are top integrators.
The “Filters” tab allows complete customization of the diagram:
- You can label the nodes with name (default) or initials, or completely anonymize them with random numbers.
- “Select Network” to view: Work, Access, Energy, Relational Benefits, Expertise. Most analysis is completed on the full network (the “Work” network).
- “Select Attributes” to look at the group as a whole or by any subgroup by peeling back the layers.
- “Select Personal Network” to view the network of one person (this view also shows the connections among those people connected to the individual chosen.
- “Settings” in the upper right allows you to change the size of the nodes (in larger networks, the nodes may appear quite small), the arrow size, and the color of the nodes (allowing you to re-combine groups).
- When viewing the network by a ranking attribute (such as the biggest collaborative challenges), only the items ranked #1 are considered. However, the export file contains ALL selections.
- When viewing the network by “Expertise Sought” or “Expertise Possessed”, only the expertise areas ranked #1 are considered. However, the export file contains ALL selections.
A worthwhile exercise is to consider the key points that exist in your network: the key connectors at the center, those who are on the periphery of the network, those who knit together groups, and clusters of people with little collaboration (i.e. potential silos).
Tips:
- Whenever a change is made to the filter, be sure to click “Re-draw Diagram” for the revised network map.
- If you want to reposition the diagram, you can use the arrows on the keyboard or your mouse. You may also “Hide Legend” or Hide Menu” to create more space for the diagram.
- To examine Brokers or Integrators in the Network Summary, be sure to select an attribute in the Filter so there is a boundary selected.